30 Tips & Tricks with the Firefox Developer Tools

I’ve curated a series of productivity tips and tricks that help me debug web applications with the Firefox Developer Tools.
If you wonder why this came to be, the reasons are simple enough:
- I’ve been using the Firefox DevTools every single day since they were being developed. Initially as the QA Owner for a bunch of them and after that in my day to day work as a JavaScript Developer on the open web.
- The Chrome DevTools get a lot more love on the internet, but Firefox DevTools have an amazing engineering team behind them with a lot of useful features. Some are on par with Chrome, some are better and some aren’t even in Chrome yet. Of course some are better in Chrome (I’m looking at you, Debugger), and I’ll be sure to point out the differences for the tricks I’m showing when there is a difference between the two.
Page Inspector
CSS Selector Search

You can use CSS Selectors in the Page Inspector search box. It’s really handy for:
- elements with a `z-index` that you can’t directly right-click onto
- looking for generic text elements that you know the selector of
- finding elements that are visually the same but have a specific class/selector
Filter Styles in the Rules view
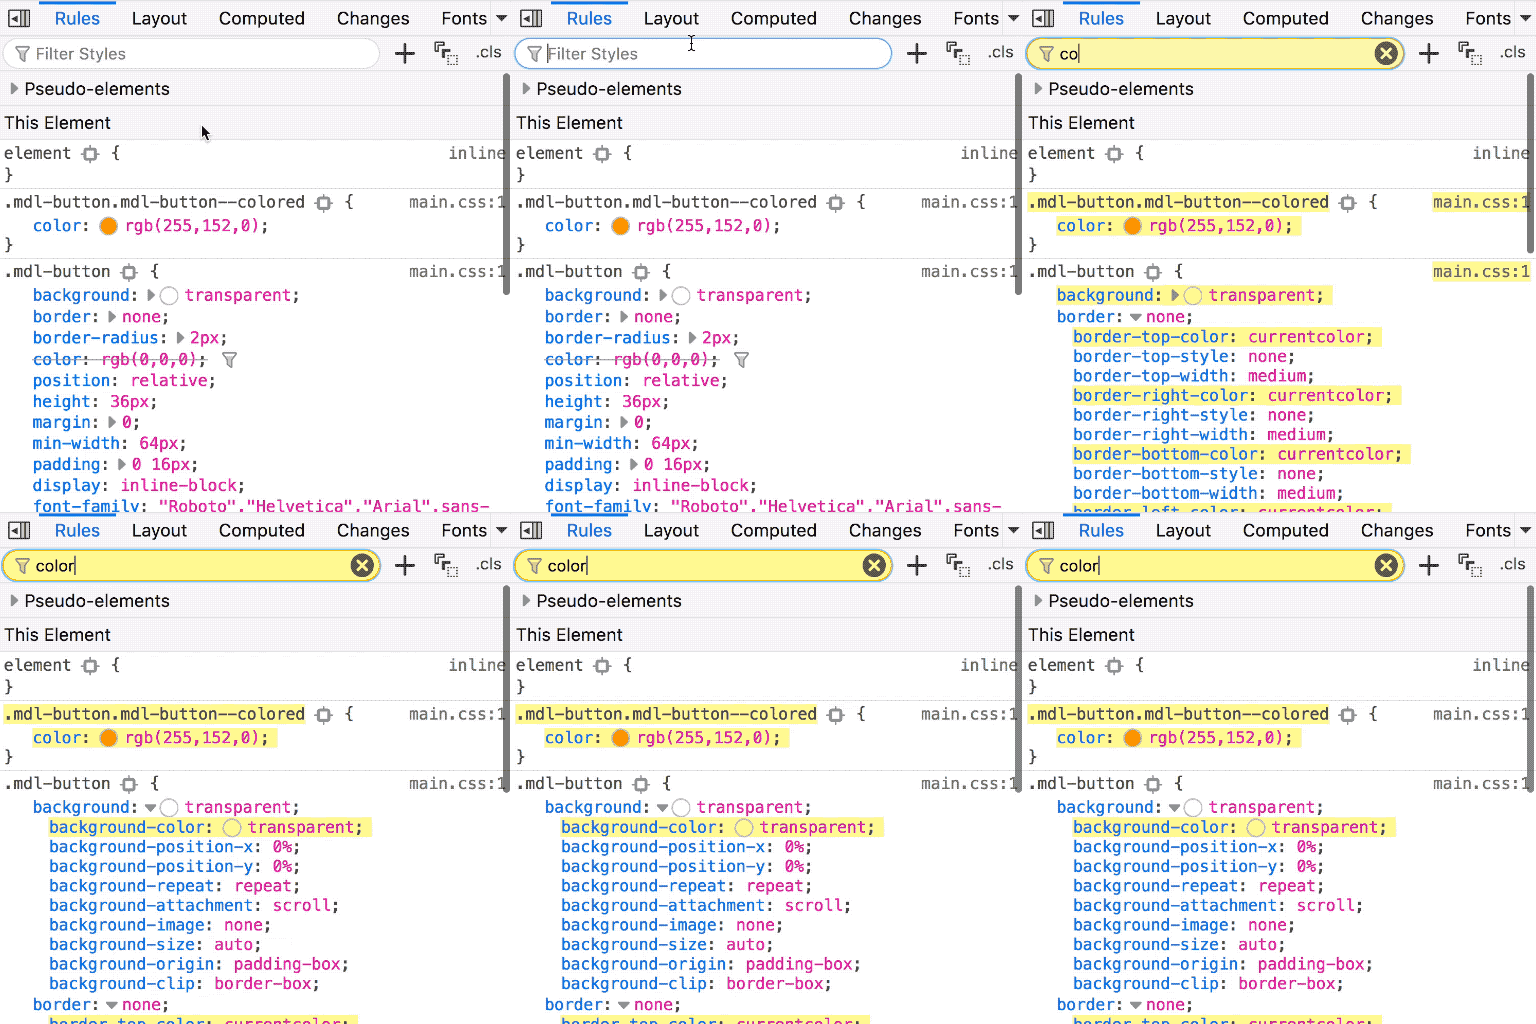
You can filter the CSS rules in the Styles view of the Inspector by any selector or property. For selectors, it highlights the selectors in the rules list. For properties, it expands all the properties containing your filter inside (e.g. the border shorthand has border-color in it), it highlights the properties containing your filter and it hides the rules that don’t. It’s really handy when you’re using competing selectors in a framework, focuses just the things that are related. Or when you have composed properties like border or background, because it expands them into the composing properties that have the filtered property in it.
Color Picker & Eyedropper tool in the Rules view
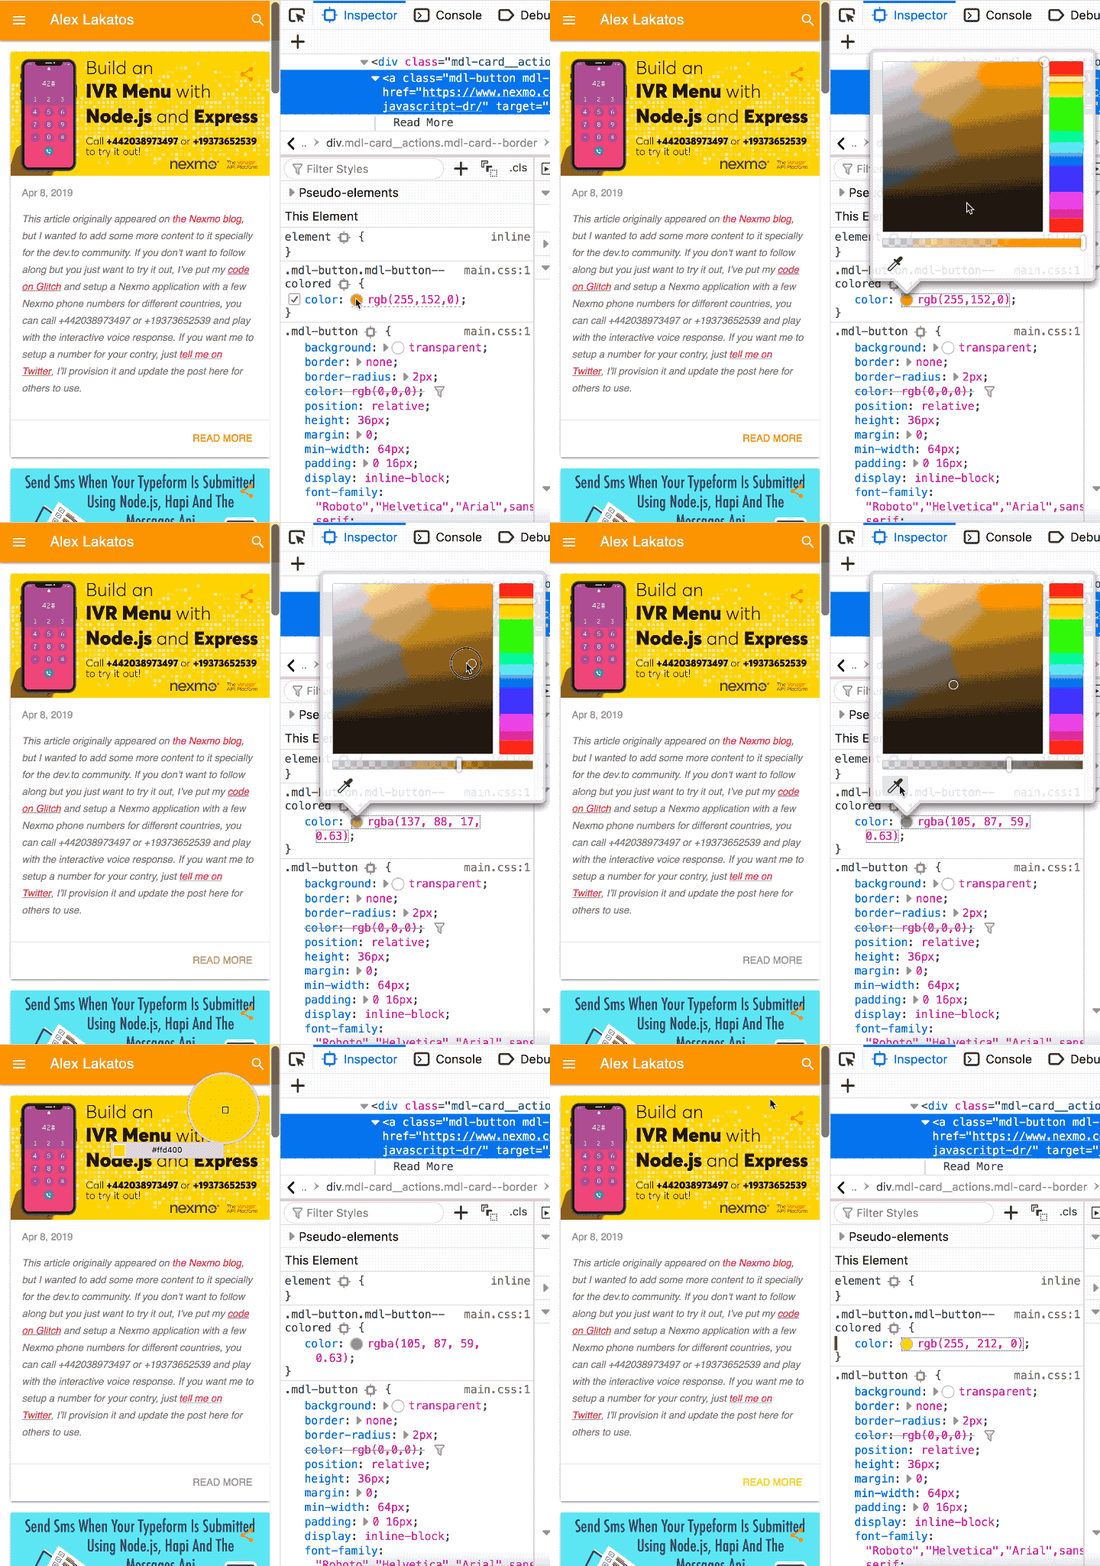
Click on the colored dot next to any color property and it opens a color picker with a handy eyedropper tool. The eyedropper has magnification when you hover the page, so it’s easier to pick the color from a specific pixel. Really handy if you’re a visual person and want to fiddle with the color in place or if you want to use colors from a different part of the page without changing between the rules to get the color.
Color Representation in the Rules view

SHIFT + Click on any colored dot next to a color property and it changes between the 3 or 4 (not all colors have a name, so you’d have only 3 representations for those colors) color representations available for the color: name, hex, hsl and rgb. It works the same for angles, if you SHIFT + click the dot next to a rotate degree unit, it shifts representations between deg, rad, grad and turn. Really handy when your style guide asks for HEX colors but you’re more familiar with hsl or rgba.
Timing Function Bézier Editor in the Rules view
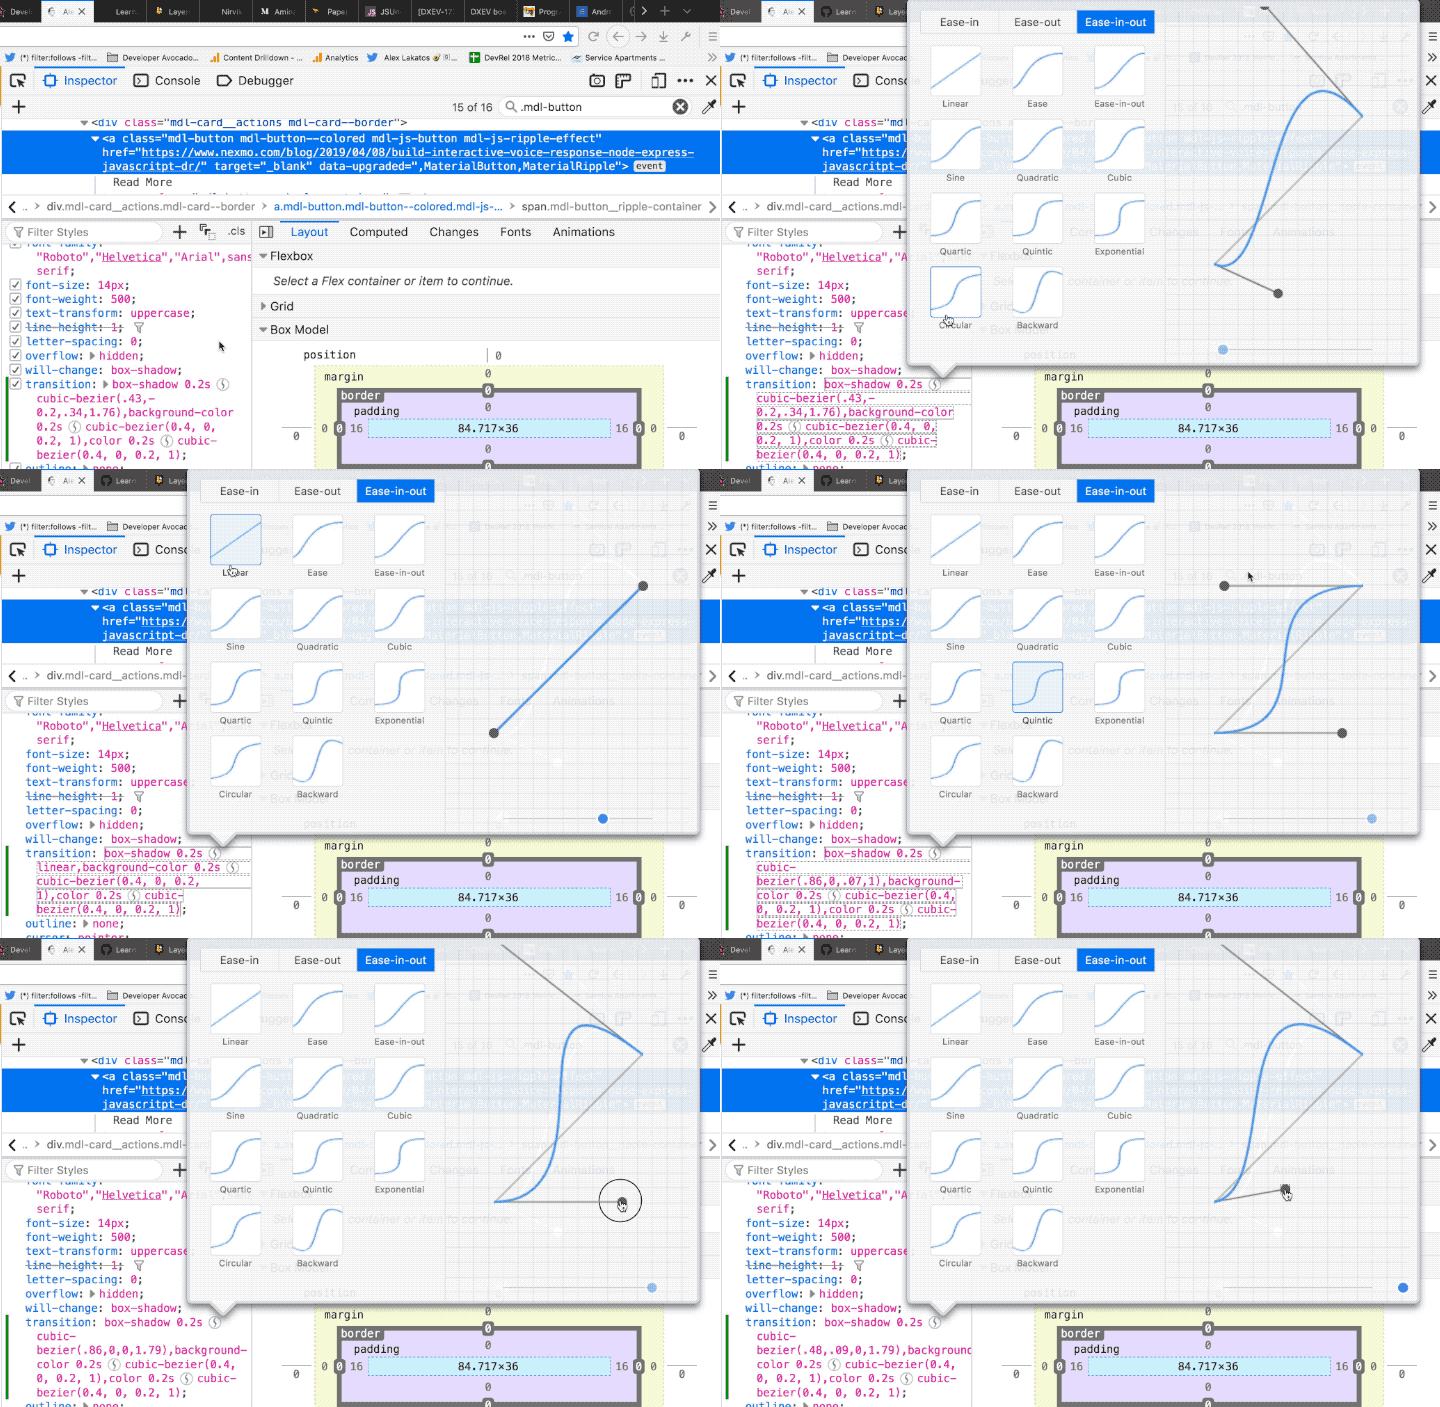
You can click on the curved line dot next to any property with a timing function (e.g transition, animation), and it opens up a set of predefined transitions plus a Bezier curve editor. Really handy to test out transitions, there is an animated slider that shows you the timing, and especially handy if you want a custom functions, it calculates the cubic Bezier curve for you.
Web Console
CSS Styling in the output
console.log(“#%c%s%c%s”, “color: #bada55”, “dev”, “color: #c55”, “tricks”)
You can style your Firefox Developer Tools Web Console output using CSS. Not all properties are supported, but quite a few are. The %c directive indicates that whatever comes after it will be styled, while the %s is string substitution. It’s really handy for:
- highlighting the important parts of a log.
- multiple color coded level of logging, when
console.info,console.warnandconsole.logare not enough.
Search Web Console History
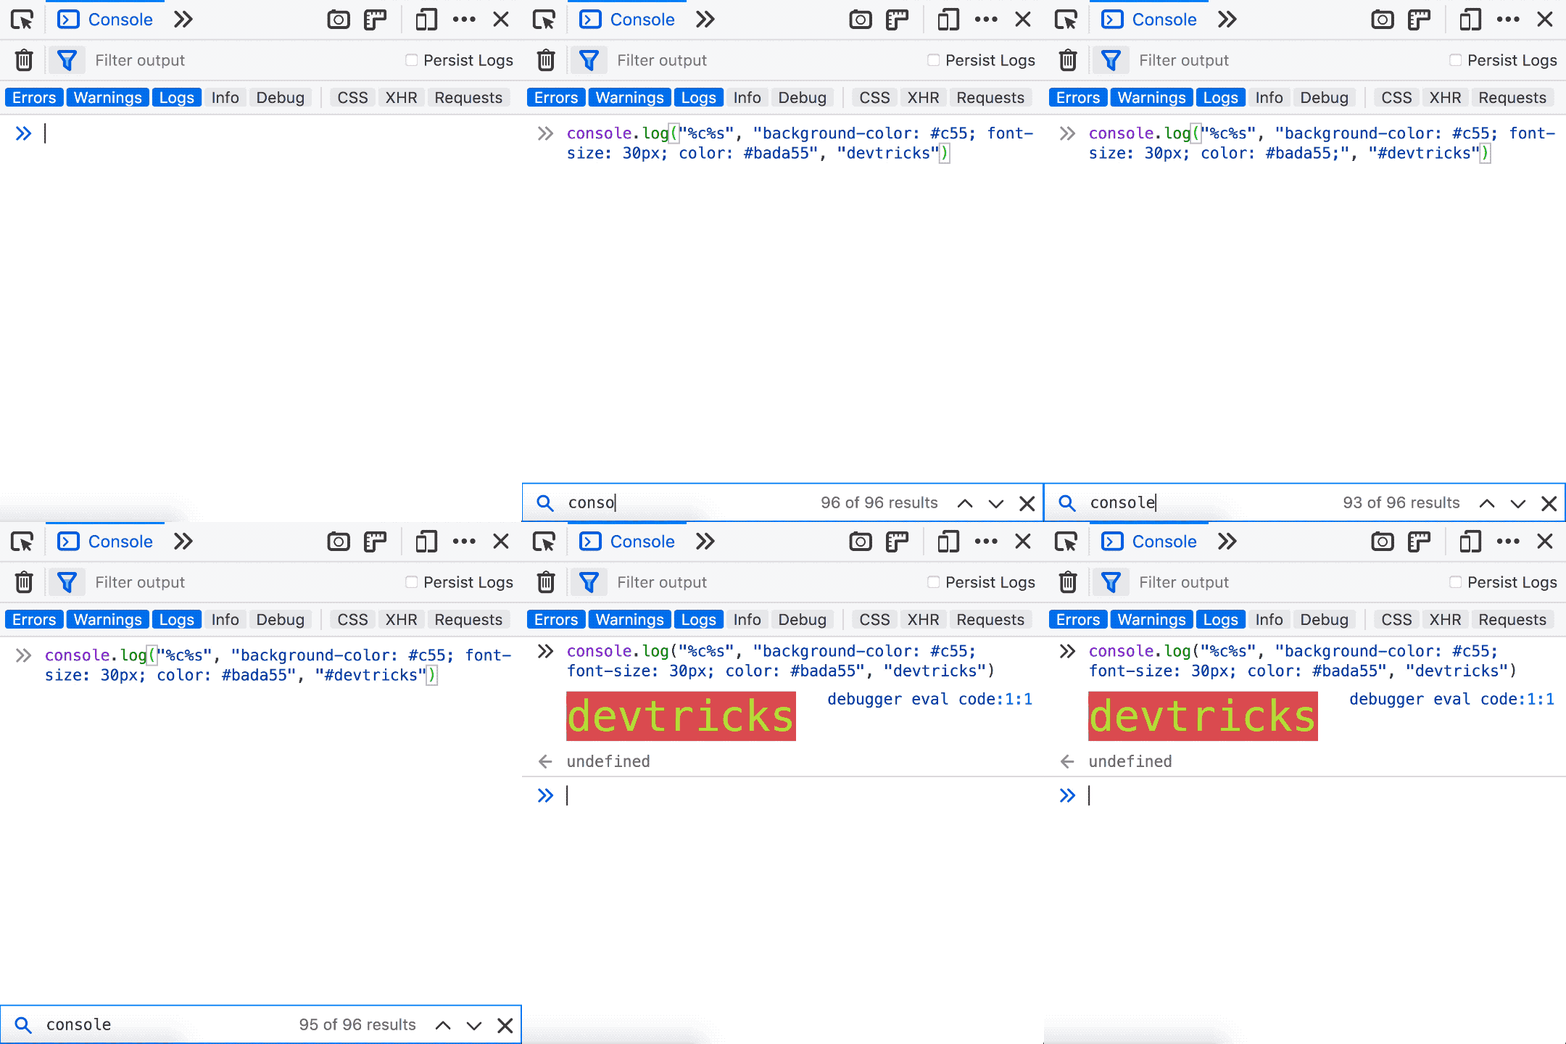
You can search through your Web Console history by pressing CTRL+R on a Mac (F9 on Windows and Linux). After that you can use CTRL+R / CTRL+S (F9 / SHIFT+F9) to move forward/backwards through the search results. It’s really handy to use instead of using the arrow keys, especially since the arrow keys only work for the current session.
Screenshots of a Page or Element on a Page
:screenshot — fullpage
:screenshot — selector .css-selector
You can take screenshots from the Web Console, of the visible section, the full page or an element on the page identified with CSS selectors. Really handy when you want to screenshot just an element exactly, without having to guess at the box model when you try to crop it out of the page screenshot.
Switch the Web Console JavaScript Context
cd(iframe)
You can switch the Web Console’s JavaScript evaluation context to an iframe using cd(). You can use CSS selectors to target the iframe. It’s really useful to change the iframe in context, especially in places where you can’t open the iframe in it’s own window, like Codepen.
Labeled timer in the Console API
console.time(“#devtricks”)
console.timeEnd(“#devtricks”)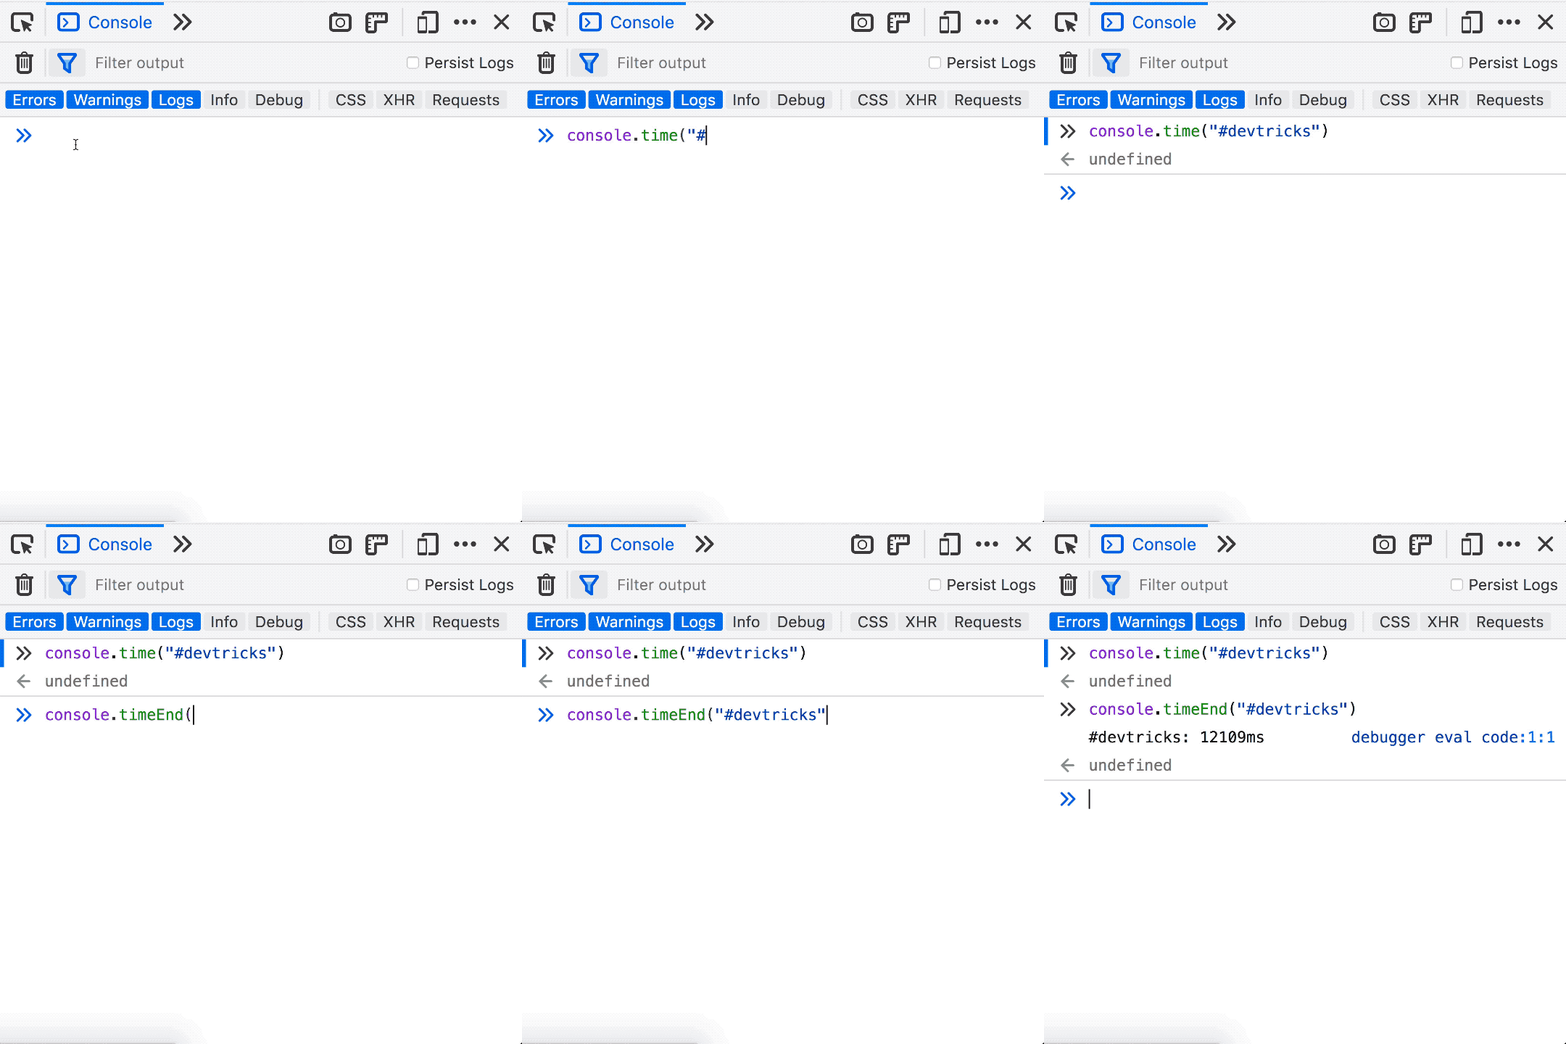
You can start a labeled timer from the Console API using console.time(“label”) and stop it using console.timeEnd(label). It’s really handy when you want to log function execution times to the Web Console, keep track of them and label them accordingly.
JavaScript Debugger
Set Conditional Breakpoints

You can set conditional breakpoints in the Firefox Developer Tools JavaScript Debugger by right-clicking the line number. The breakpoints will become active and pause the execution only if the condition is met. It’s really handy for debugging intermittent bugs and pausing execution on specific values and ranges.
Search by Function Name or Line Number
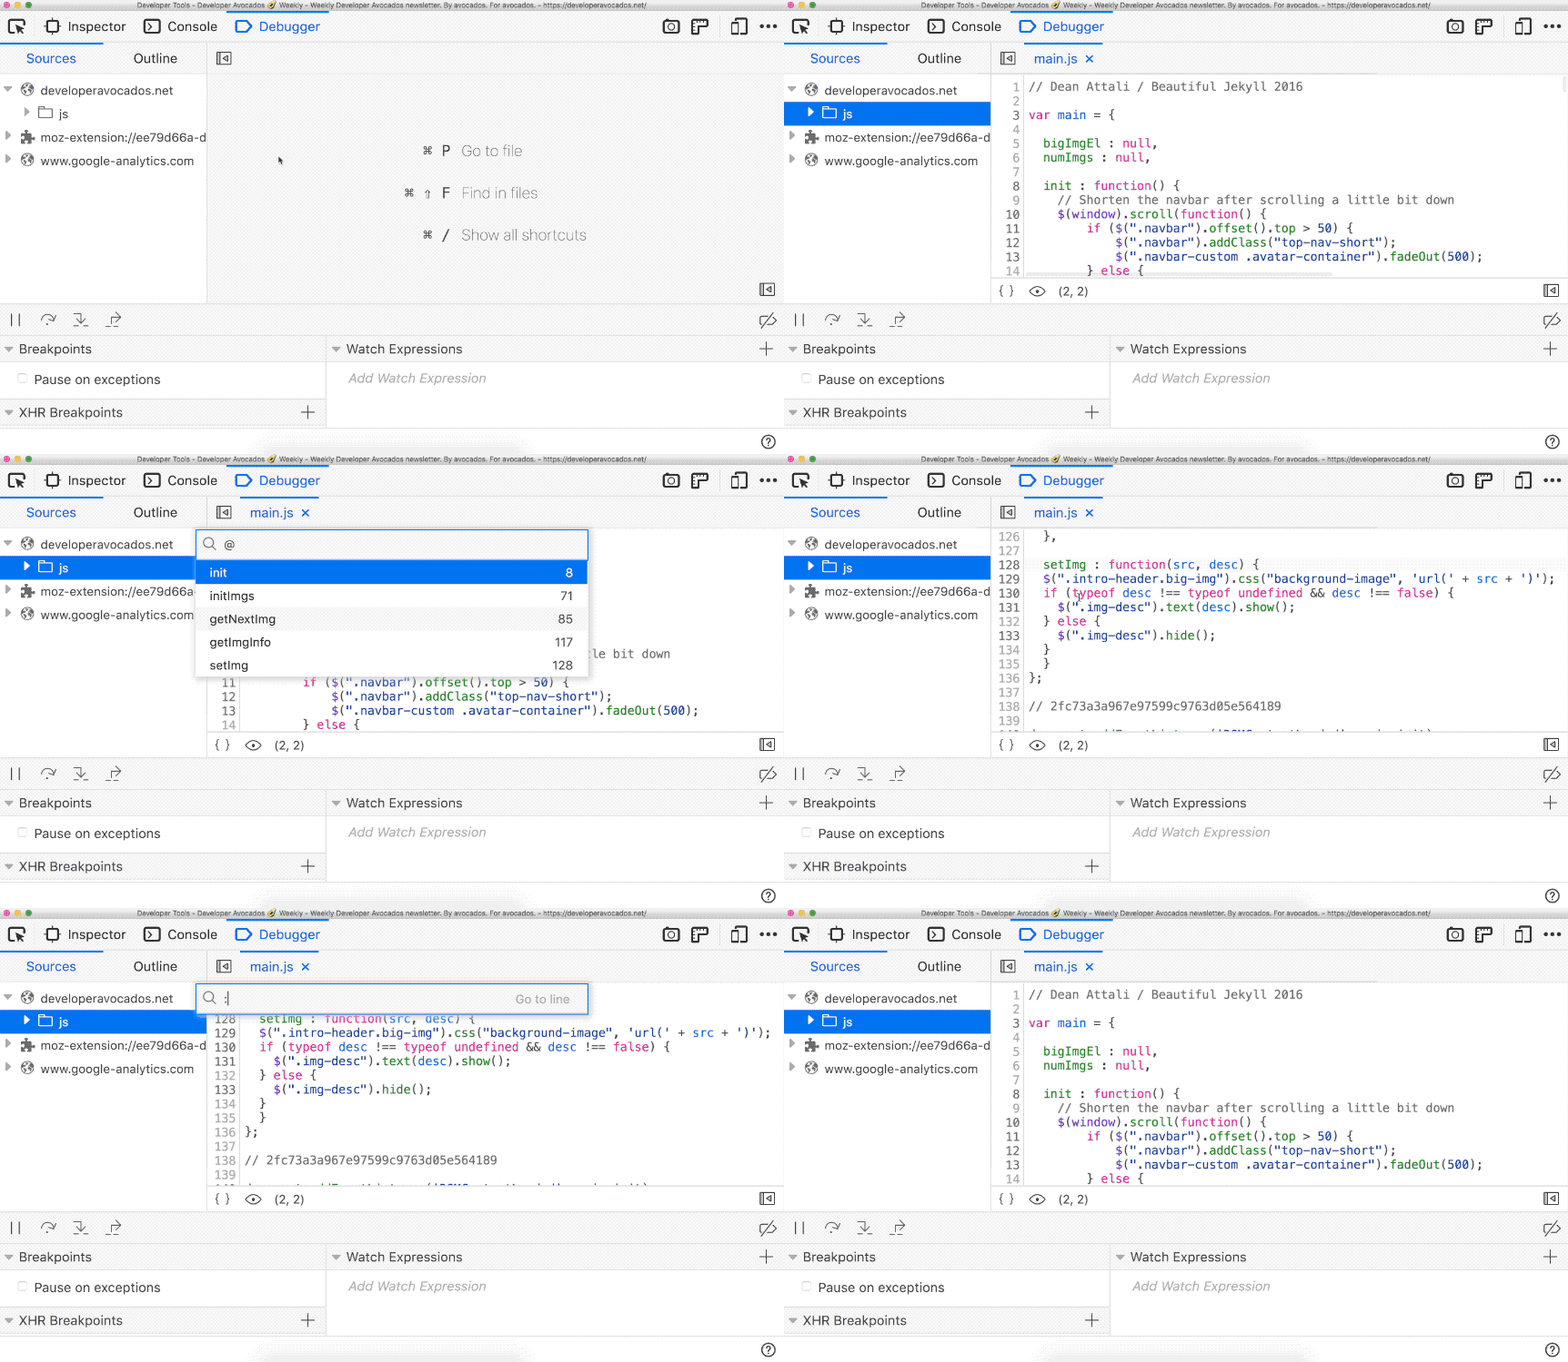
You can search for a file name through the JavaScript Debugger by pressing CMD + P on a Mac (CTRL + P on Windows and Linux). If you want to search for a function inside that file or go to a line number directly, there are other shortcuts, but I always forget them. Instead, you can type @ in the same search box, and that looks for a function definition. If you start your search with :, that will go to a specific line.
Pretty Print Minified Code
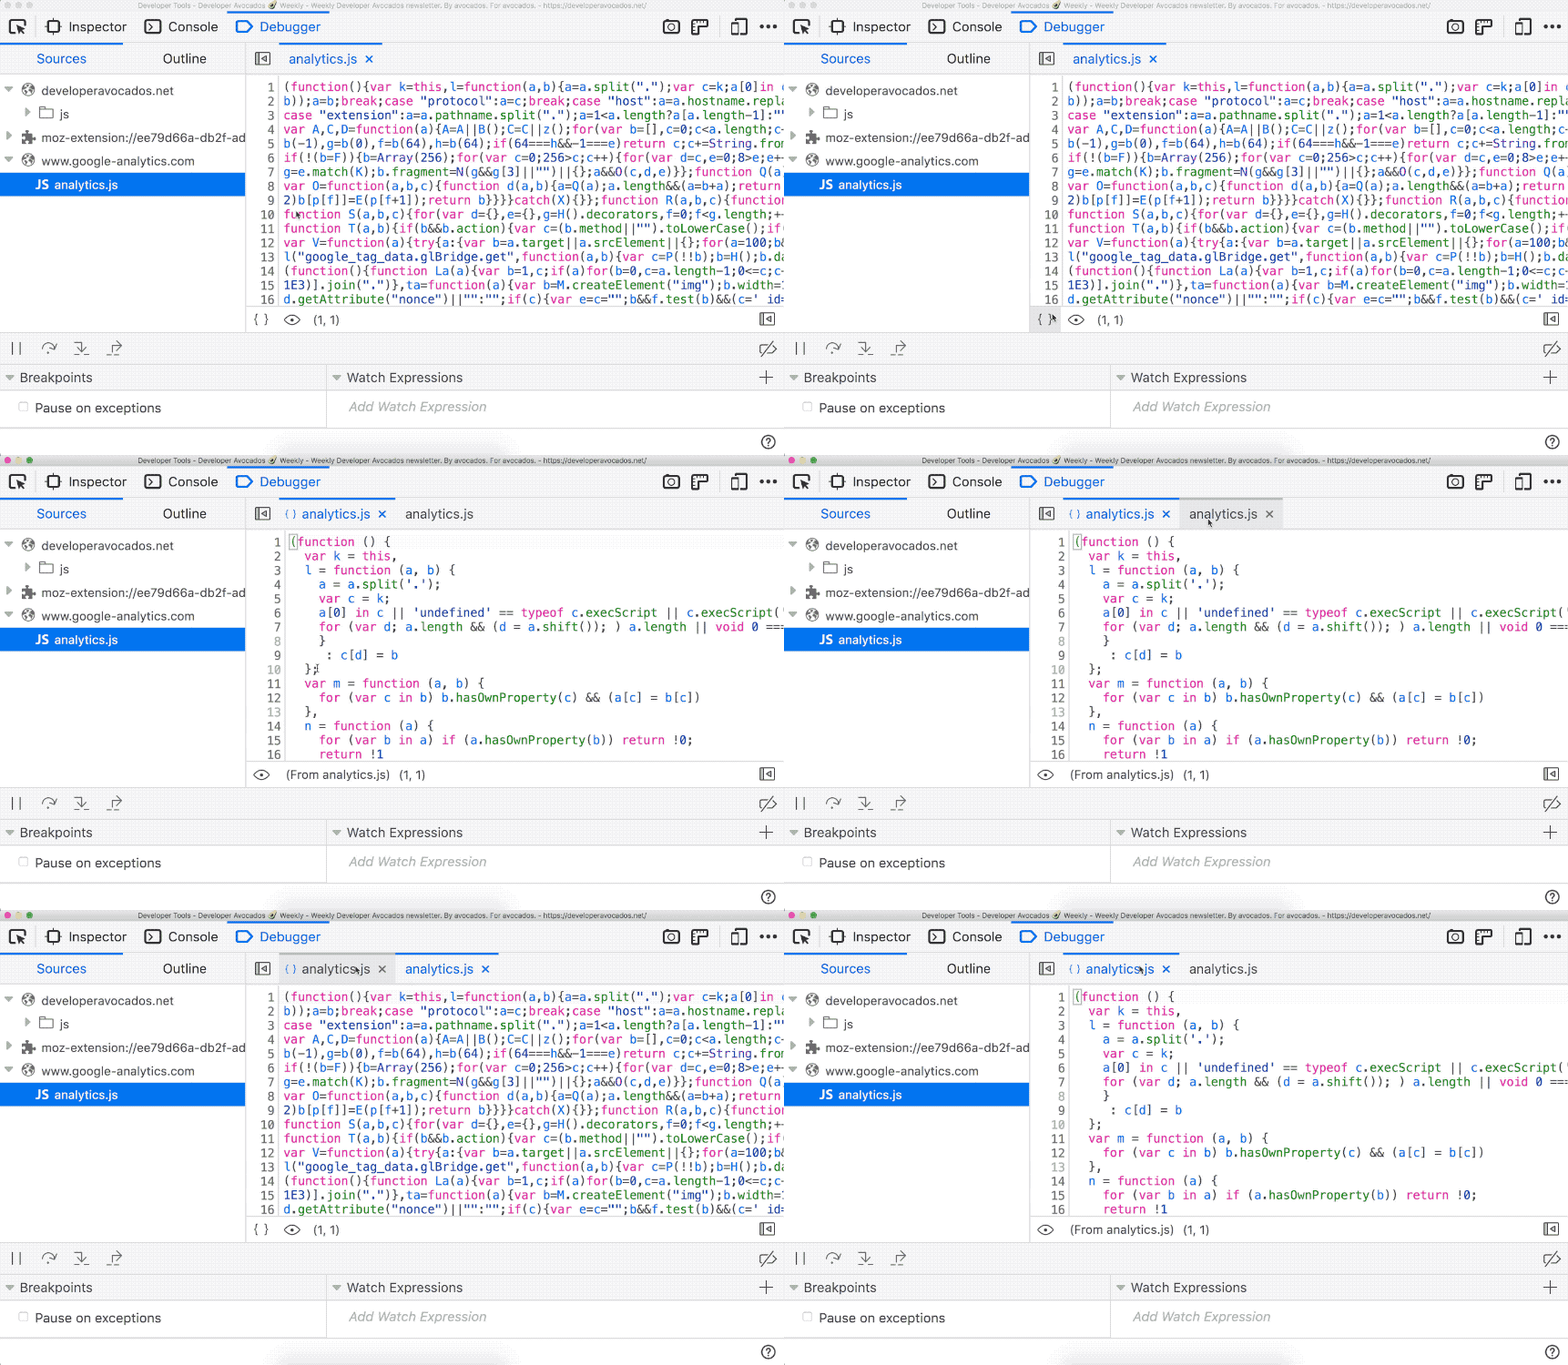
You can pretty print minified code in the JavaScript Debugger by pressing the {} icon. I use it mostly when trying to do a little debugging in production or other people’s websites, and there are no source maps available.
Set URL Breakpoints

You can set URL breakpoints in the Firefox Developer Tools JavaScript Debugger. The breakpoints will become active and pause the execution when the page tries to access an URL matching the rule you’ve set. It’s really handy for evaluating the state of your application when network requests happen, as well as pinpointing the exact line of code that triggered a network request.
Disable Breakpoints
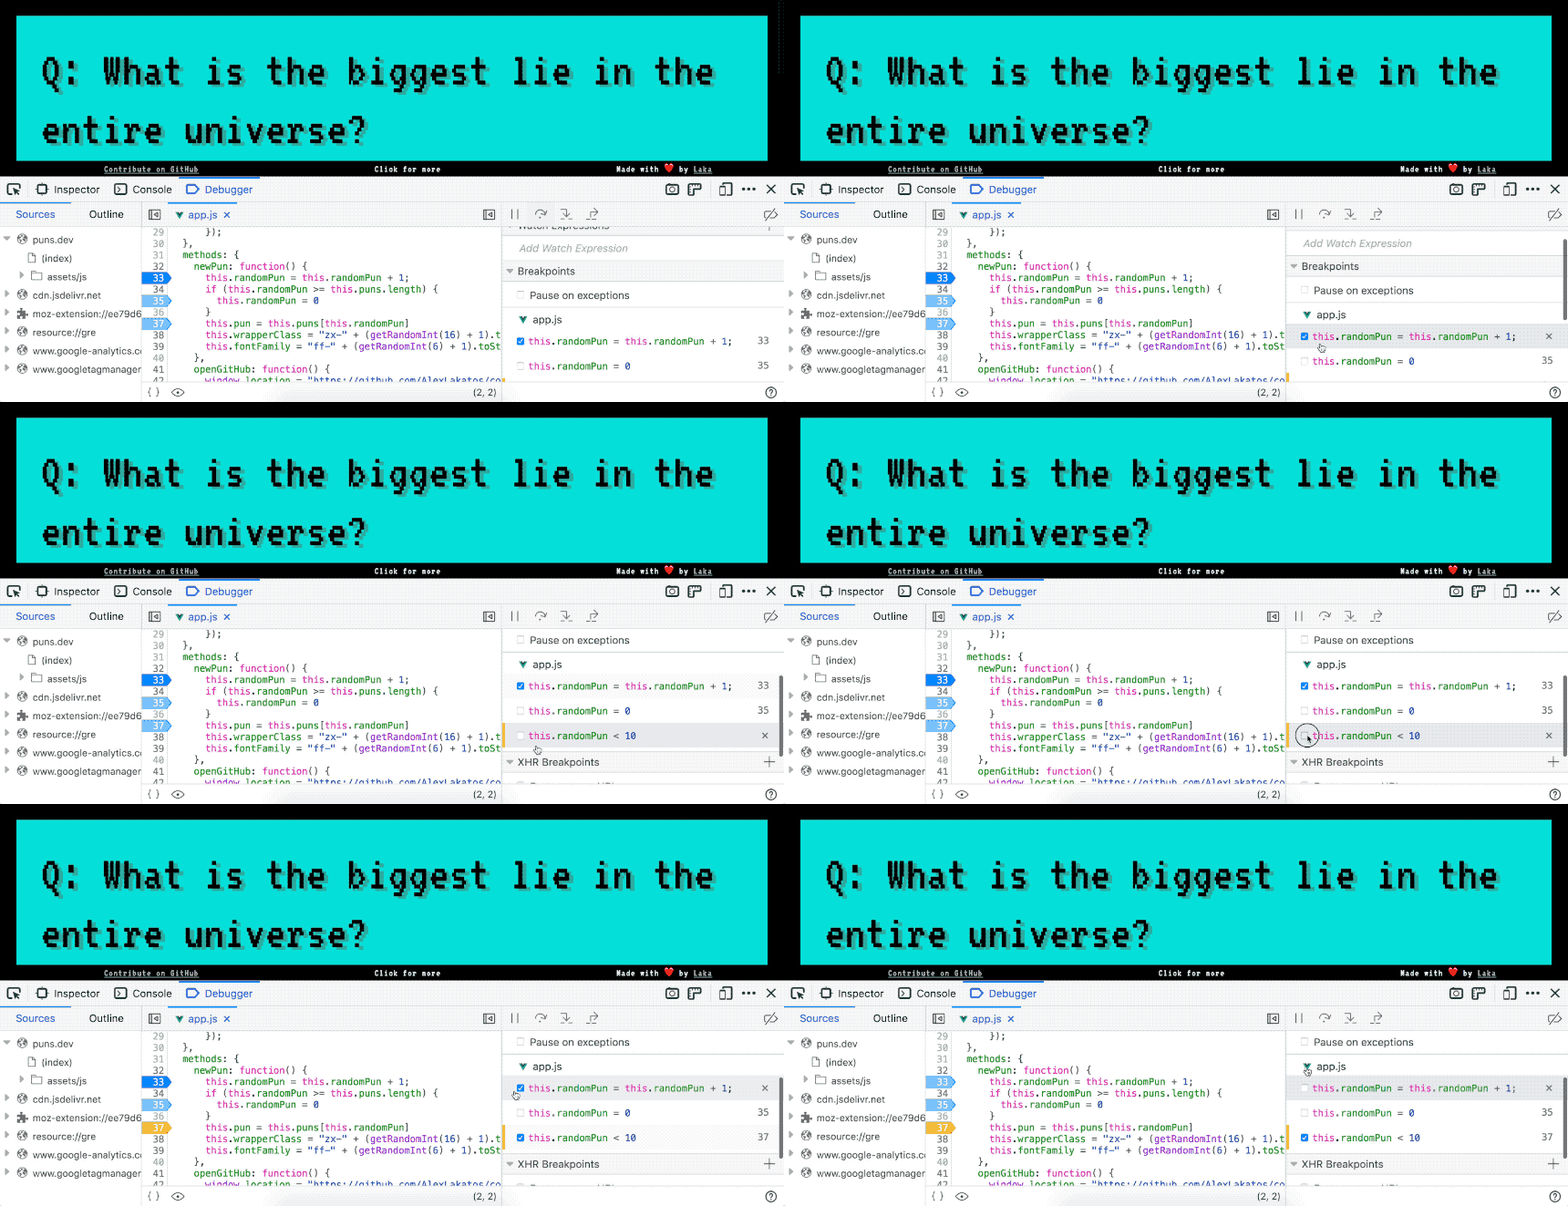
You can disable and re-enable breakpoints in the Firefox Developer Tools JavaScript Debugger. They will remain set, but become inactive and will not pause execution of your code. It’s really handy when debugging if/else clauses because you don’t have to remember where you’ve put your debugging points the last time.
Network Monitor
I use the Network Monitor tool when I’m doing performance debugging and optimizations on a website, so most of the tricks in this section focus on that. It’s the very first tool I use when performance debugging, because no matter how fast your JavaScript is running, it’s still a shitty performance if I have to wait for 20 MB of it to load.
Edit and Resend HTTP Requests

You can edit and resent HTTP requests in the Network Monitor. Sometimes I use it to debug POST requests that go to my server or the GET requests that get the data for the website, I rarely use this trick to re-send HTTP requests that just fetch HTML, CSS and JavaScript files or images. It’s really handy to use especially when you’re sending data to the server at the end of a complicated flow, and you’ve got a bug in your request. It allows you to quickly test a possible fix without having to do all the work and re-testing of the flow.
Filter Requests that don’t contain your query string
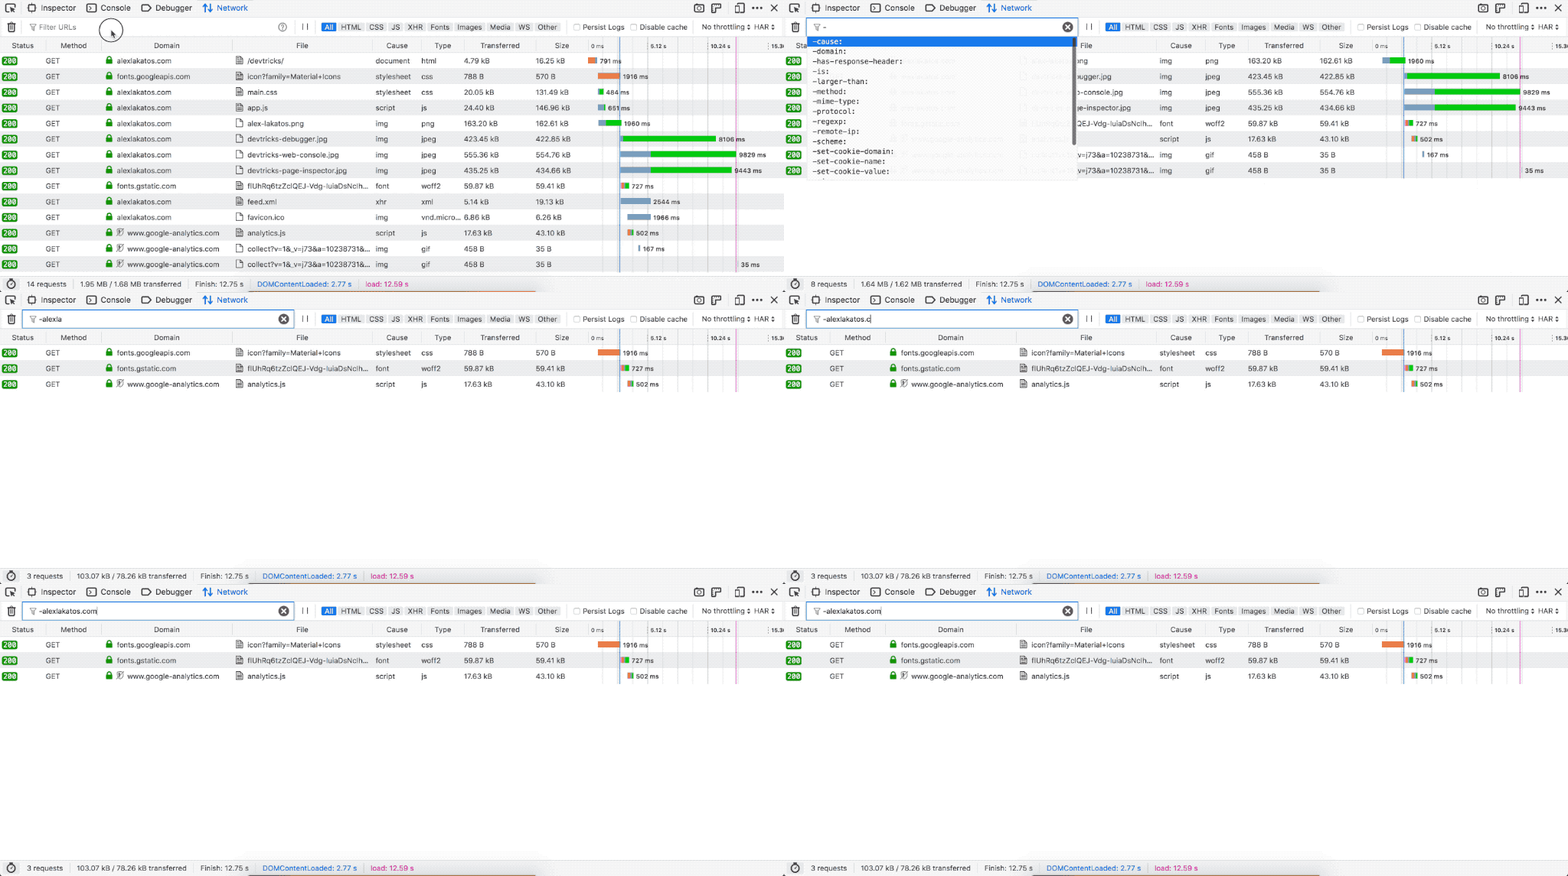
You can filter HTTP requests by domain in the Network Monitor by pressing CMD + F on a Mac (CTRL + F on Windows and Linux). If you want to search for all the requests that don’t contain a string in the domain URL, you can start your query with a dash (-), and that filter only the domains not matching the query string. It’s really useful to find all the external requests during a performance audit, so you can later move those resources to the same domain.
Speed Throttling
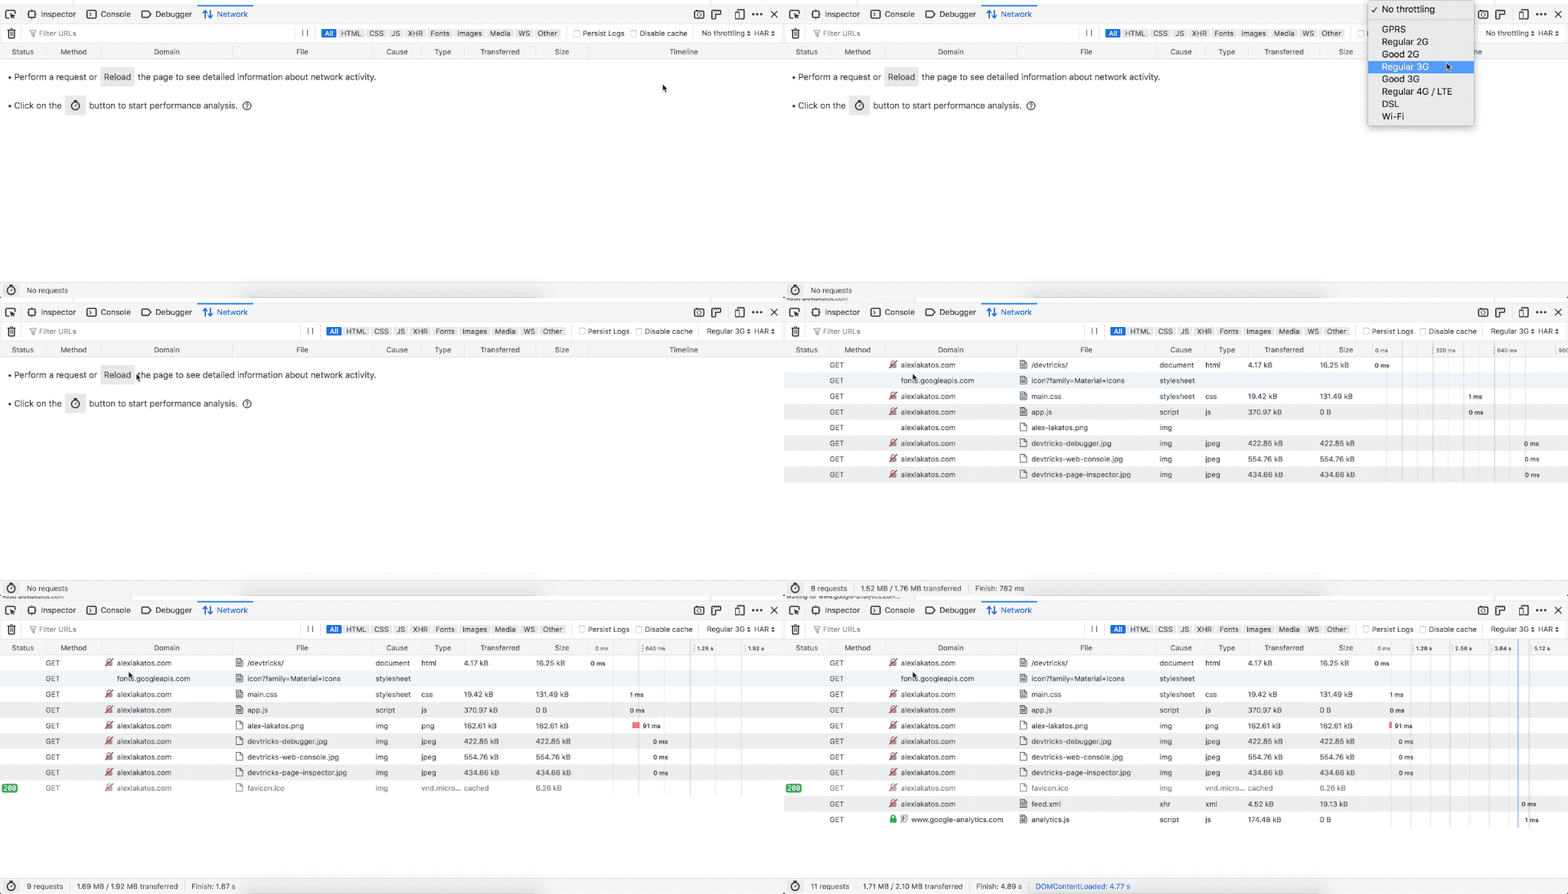
You can throttle the speed of your network requests and see how your website loads on different connections. Firefox has a lot of presets useful for mobile devices, with an intuitive name instead of me having to guess what speed a bad 3G connection would be.
Hot/Cold Profiling
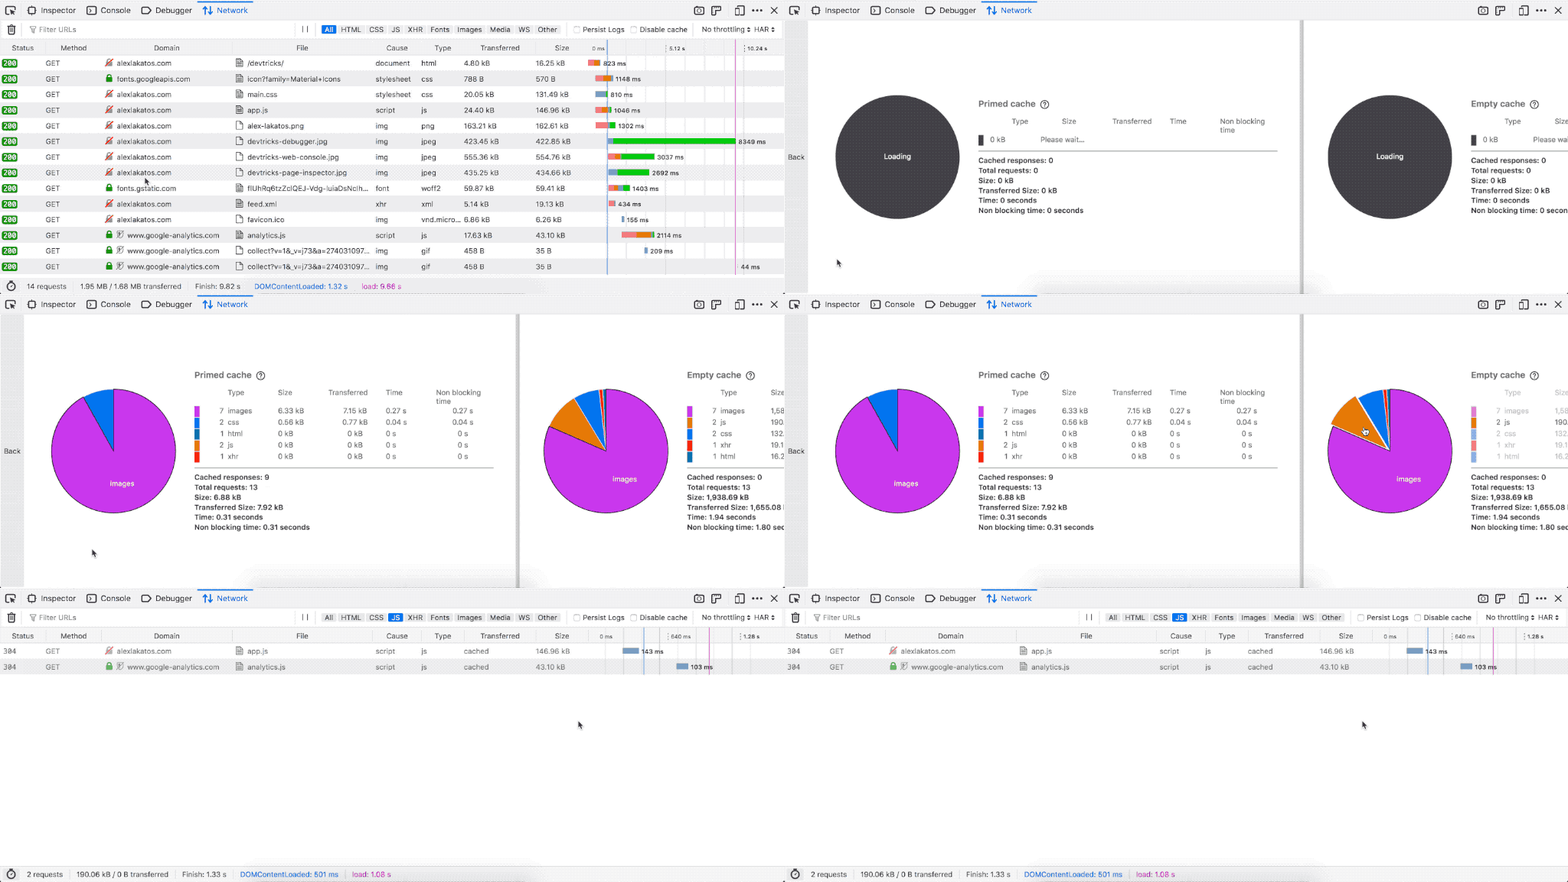
You can run visual performance analysis on the HTTP requests your website is making. If you’ve just opened the Network Monitor, there is a stopwatch icon on the main panel, otherwise, you can find it in the lower left corner of the Network Monitor. Once you’ve clicked the icon, the Network Monitor loads the website twice: once with an empty browser cache or “cold”, and once with a primed browser cache or “hot”. It’s really useful to simulate the first time a user loads your site and any following visits.
Save/Import HAR
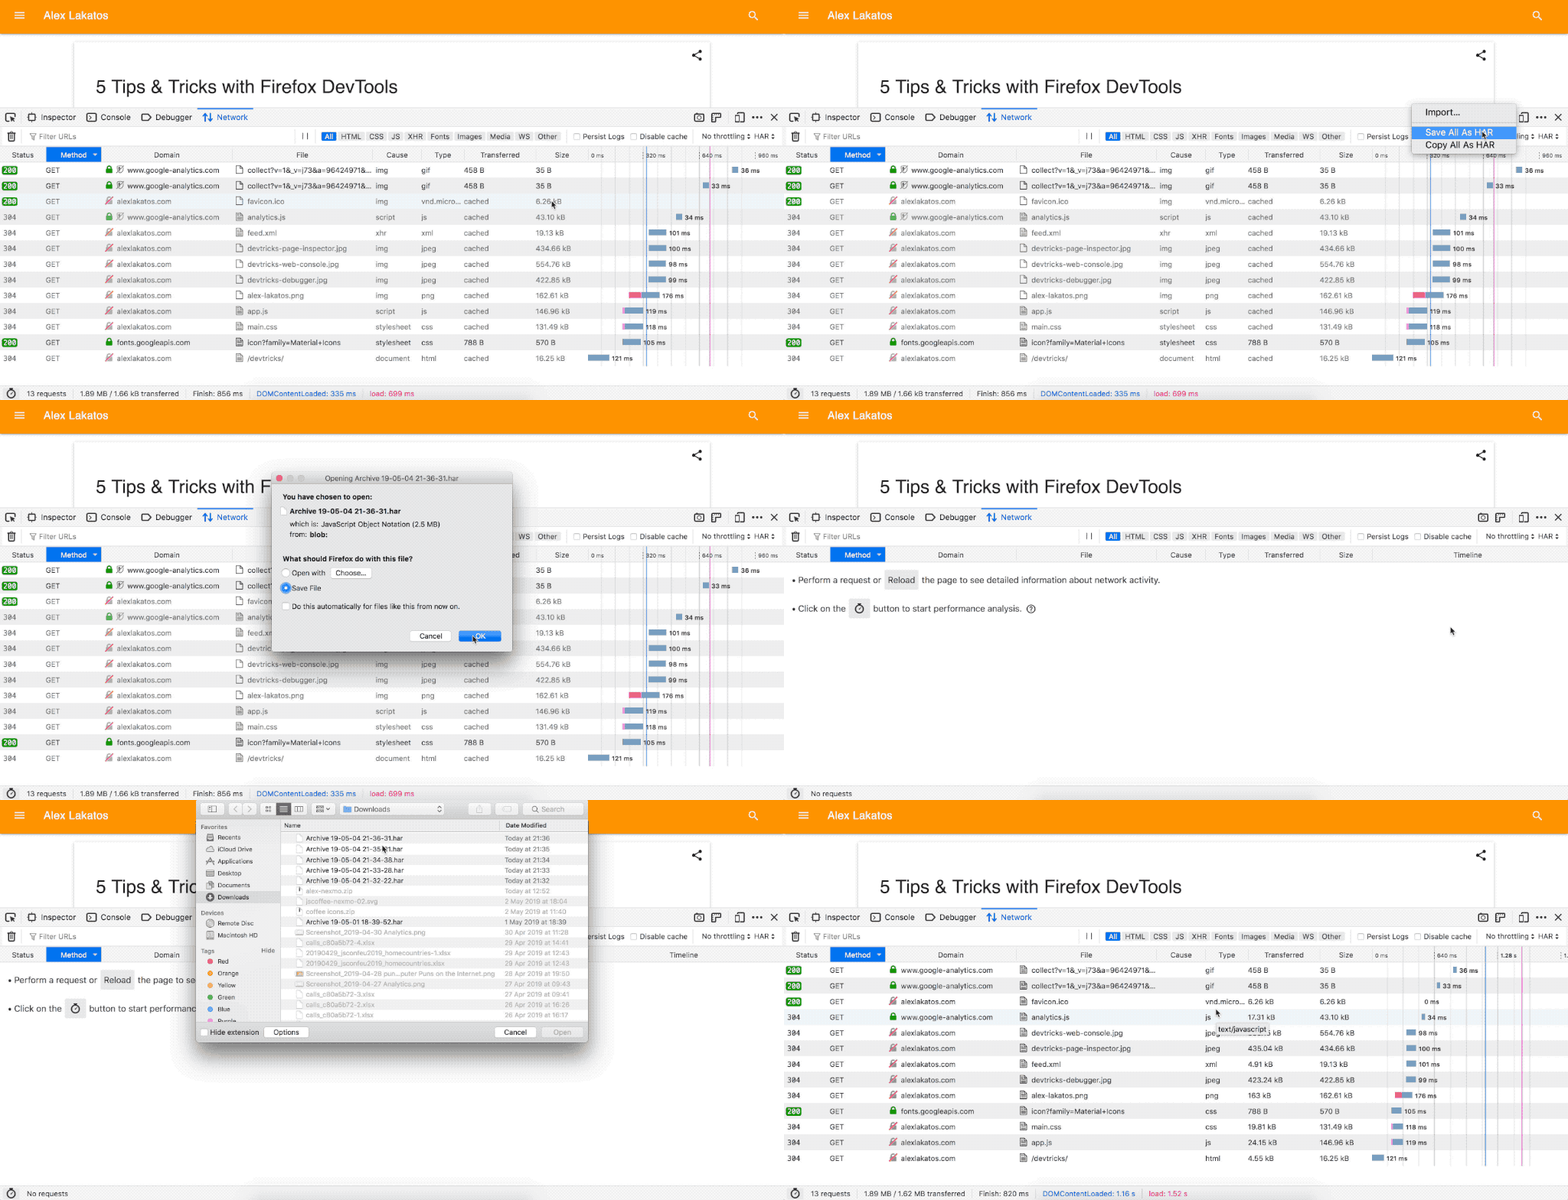
You can save a snapshot of the network requests in your Network Monitor. It saves them as HAR or HTTP Archive format. You can also import HAR files and have them display in the Network Monitor so you can debug them. This one is especially useful when working with distributed teams, different parts of the world will give you a different timeline. This way you can all work off of the same baseline, or debug that pesky 10-second delay in your images that only happens behind some obscure firewall with your backup CDN. You get the point.
Responsive Design Mode
I use the Responsive Design Mode as a quick way to test on mobile, locally, without having to deploy. The throttling capabilities, touch events, and custom sizes make it perfect for my needs. I like the fact that I have the rest of the Developer Tools active side-by-side, without having to connect them to my phone browser, and having to look in 2 separate places to debug. It doesn’t work for complex stuff, like pan and zoom, but it’s enough for one finger touch events. Sometimes I use the custom user agent just to see what kind of UA tracking websites do in general. I’m not a fan of the fact that since Firefox 60, automatic reload doesn’t happen for user agent switching or when you enable touch events, but I understand the reasoning behind the feature.
Add custom devices

You can edit the display size in the Responsive Mode of Firefox Developer tools, but if you want to make that a preset you’ll have to add a custom device. You can open the device dropdown, and select Edit list. That gives you a list of the most common presets, and you can enable/disable the ones you need. If that’s not enough, you can add your own custom device. If you think the default list should be different, Mozilla is maintaining a GitHub repo for that, feel free to submit a PR.
Throttling
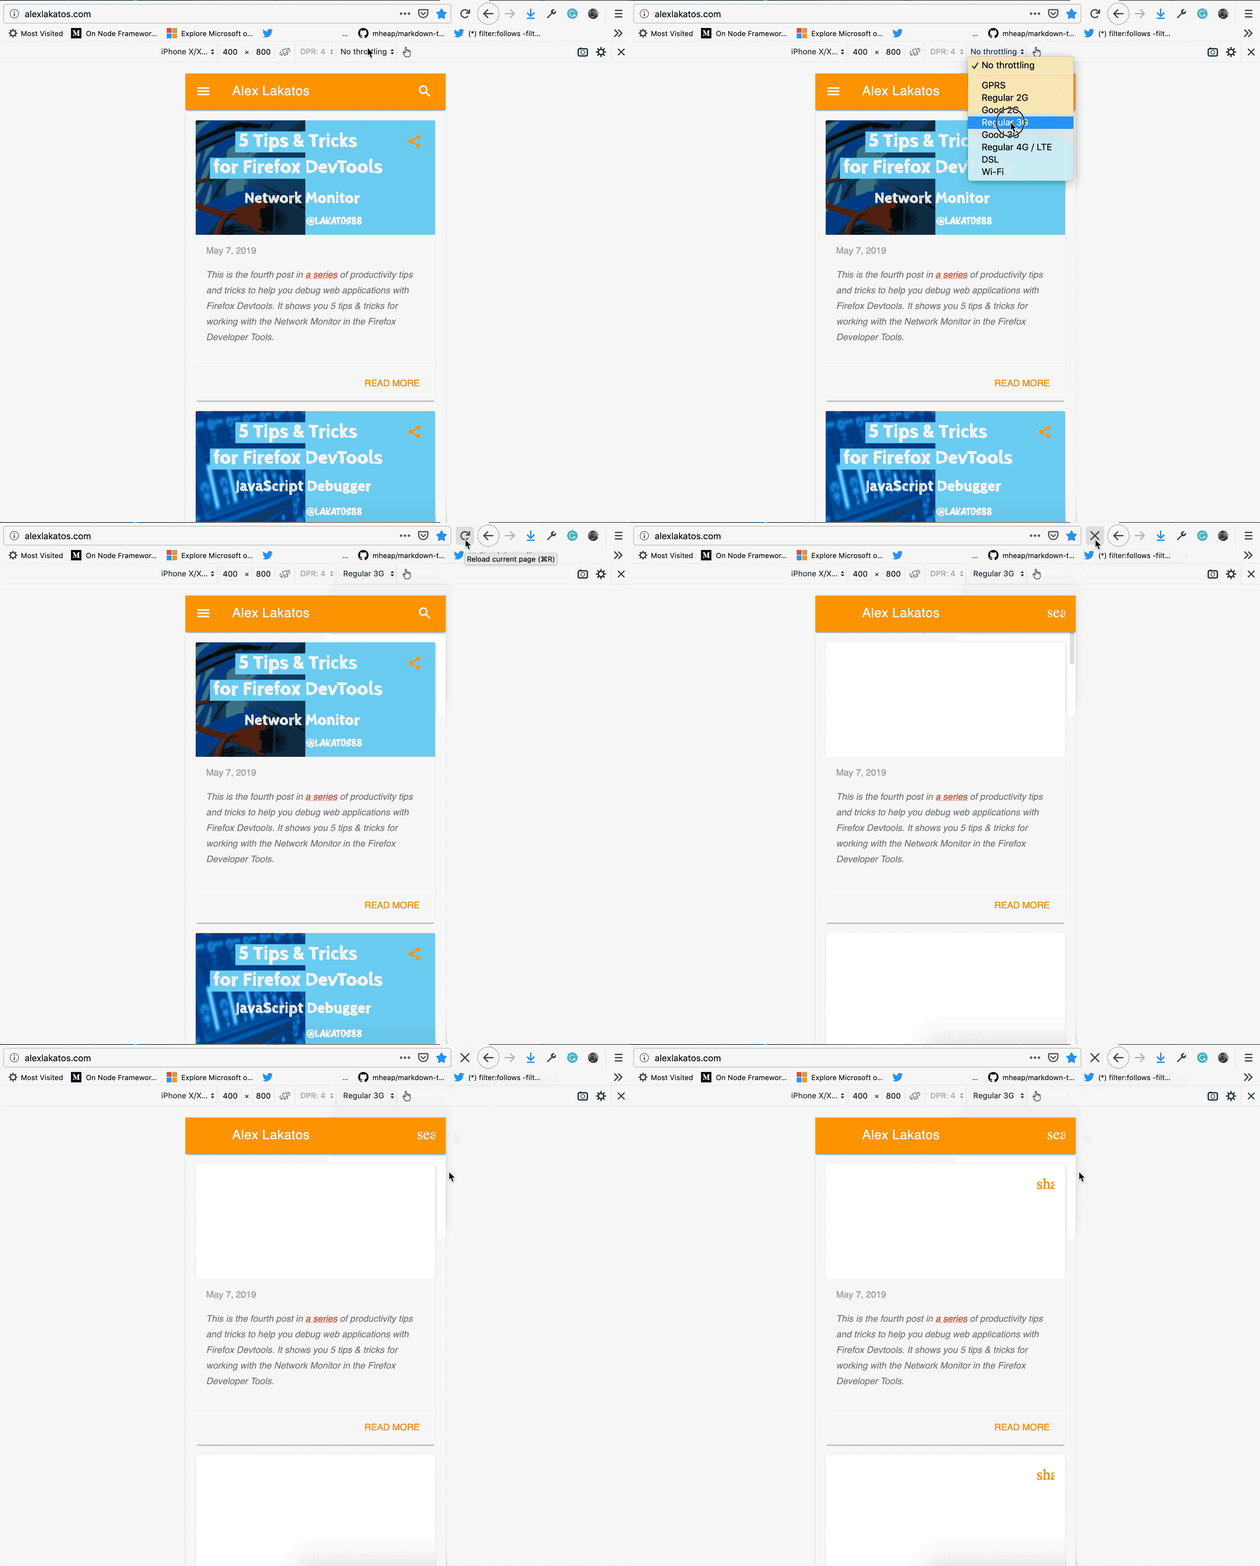
You can throttle the speed of your network requests and see how your website loads on different connections. Firefox has a lot of presets useful for mobile devices, with an intuitive name instead of me having to guess what speed a bad 3G connection would be.
Simulate touch events

You can simulate touch events in the Responsive Design Mode by clicking the little hand icon. It will disable drag-and-drop selection, and enable touch events, including tap and long-tap events. Click events will be turned into tap events and a long-click event will be simulated into a long-tap event, opening the contextual menu.
Change user agent

You can change the user agent string from the Responsive Design Mode of Firefox DevTools. You’ll have to go to the Settings icon in the top right corner and enable “Show user agent”, and then you can change it in the input field. I personally like to set the “Reload when user agent is changed” as well because most websites do their user agent detection on load. You can see here how the Google home page changes when it thinks I’m not an iPhone anymore, and I’m the DuckDuckGo crawling bot 😅.
Left align the Viewport
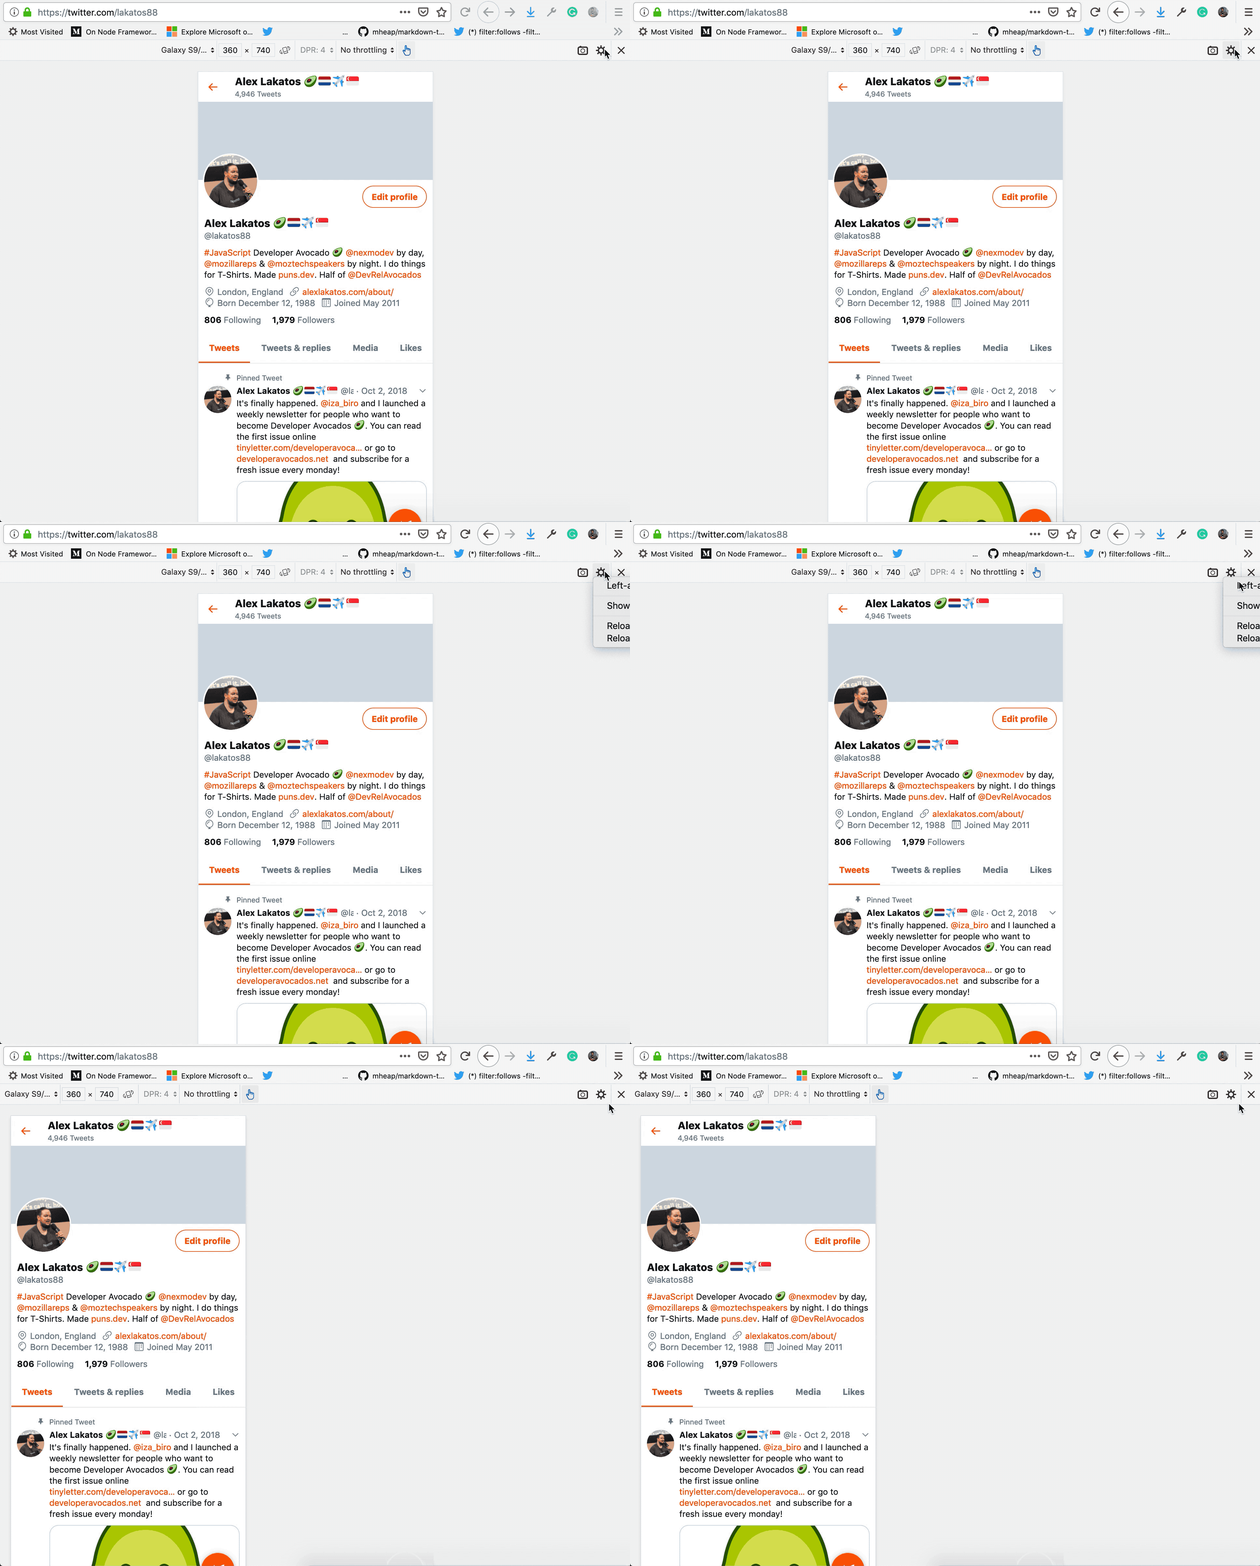
The Responsive Design Mode is centered by default, and that is all good when I’m only testing. But when I’m debugging, I’d like to be able to us as much of the rest of the screen for the DevTools panel. You can make align the Responsive Design Viewport to the left, by enabling the option in the Settings menu.
Storage Inspector
I use the Storage Inspector as a quick way to debug all the types of storage a web application can use in the browser. And sometimes I use it to mess with tracking data stored there as well 😅.
I think the ones I use the most are the Cookies and the IndexedDB tools, but recently I’ve found myself spending an increasing amount of time looking at Cache Storage, with the Cache API gaining popularity as part of the ServiceWorker life cycle.
Edit cookies

You can edit all the cookies stored in your browser, in at least a partial fashion. You currently can’t edit the greyed out columns, things that get computed like creation and last access date, or security flags like `hostOnly` and `sameSite`. To edit the other fields of a cookie, just double click the cell you want to edit and type your new value.
Delete Cookies
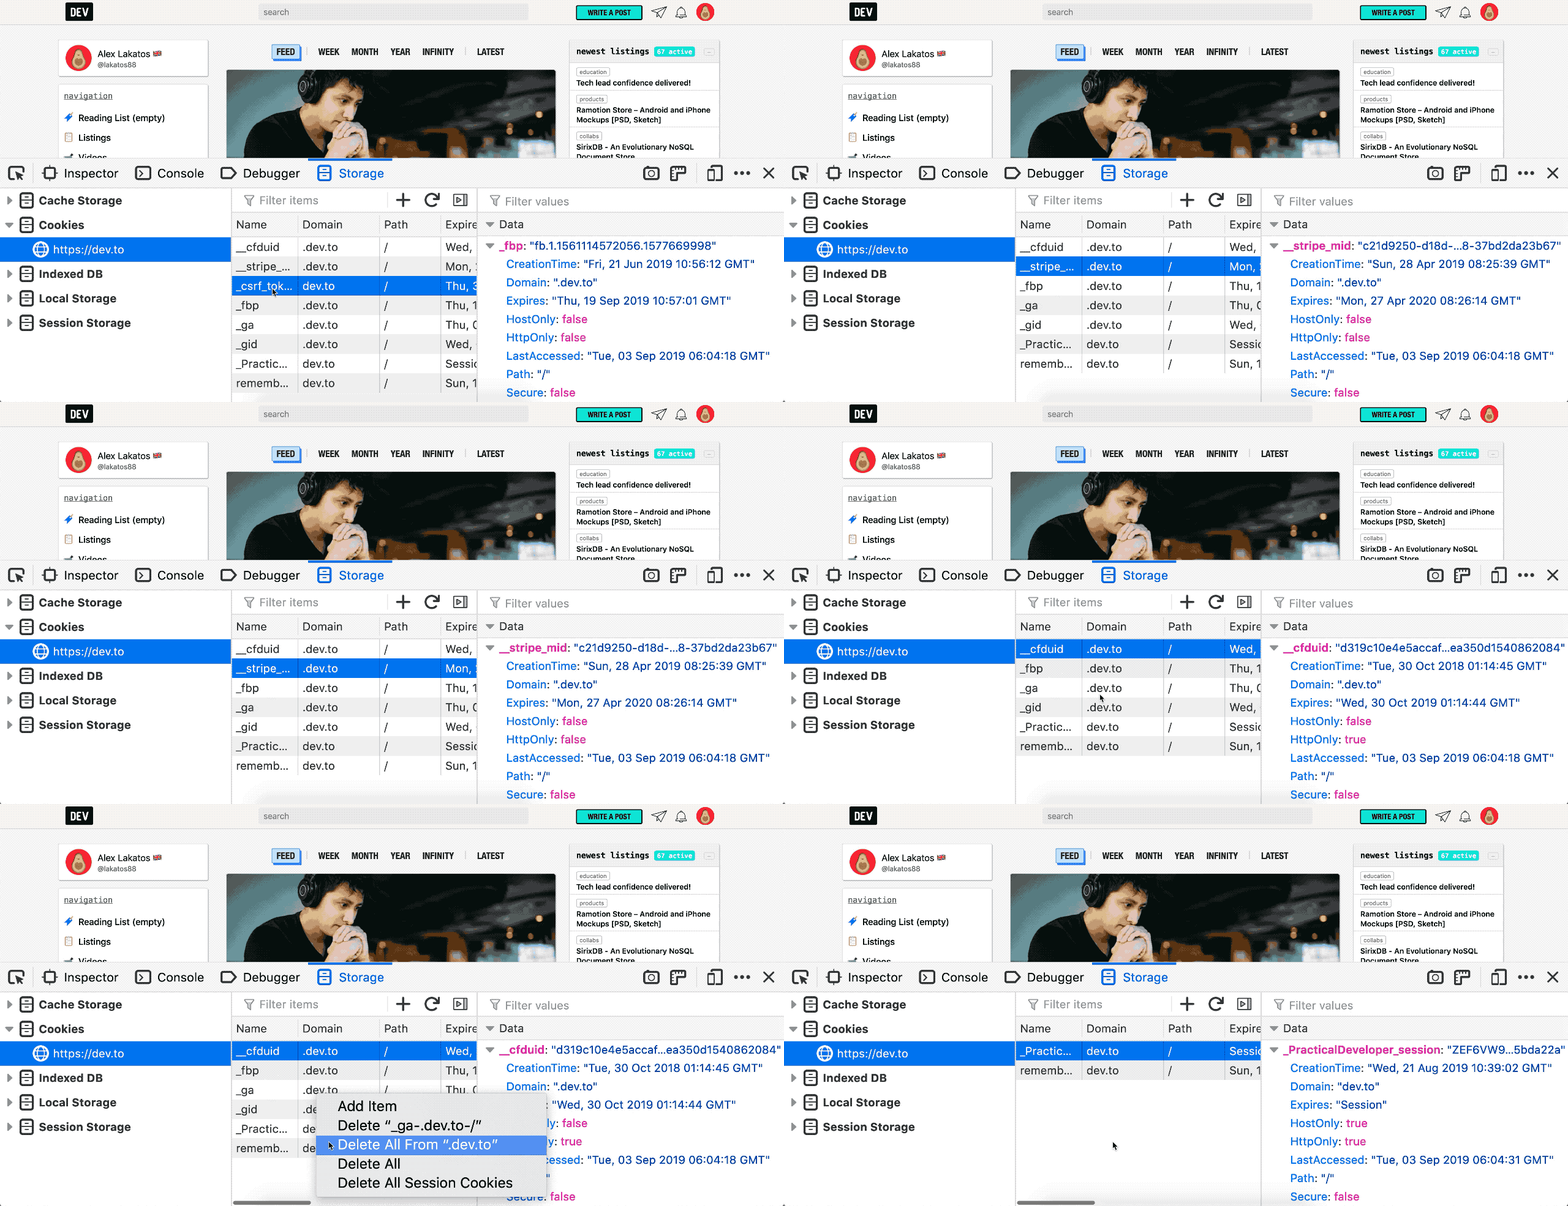
There are several ways you can delete cookies in the Storage Inspector. The easiest one is to press the Backspace key while having a row selected and that will delete the cookie. Since Firefox 68, Local Storage and Session Storage also can delete entries when you press Backspace. I think one of the most useful ones for me is the Delete all from domain feature. There’s a catch though, the domain has to be an exact match, so deleting cookies from .medium.com won’t delete cookies from medium.com and vice versa.
Realtime updates for Cookies

You can see cookies being updated in real-time while the Storage Inspector is open, and the cookie rows that are being changed will flash orange.
Static Snapshot for IndexedDB
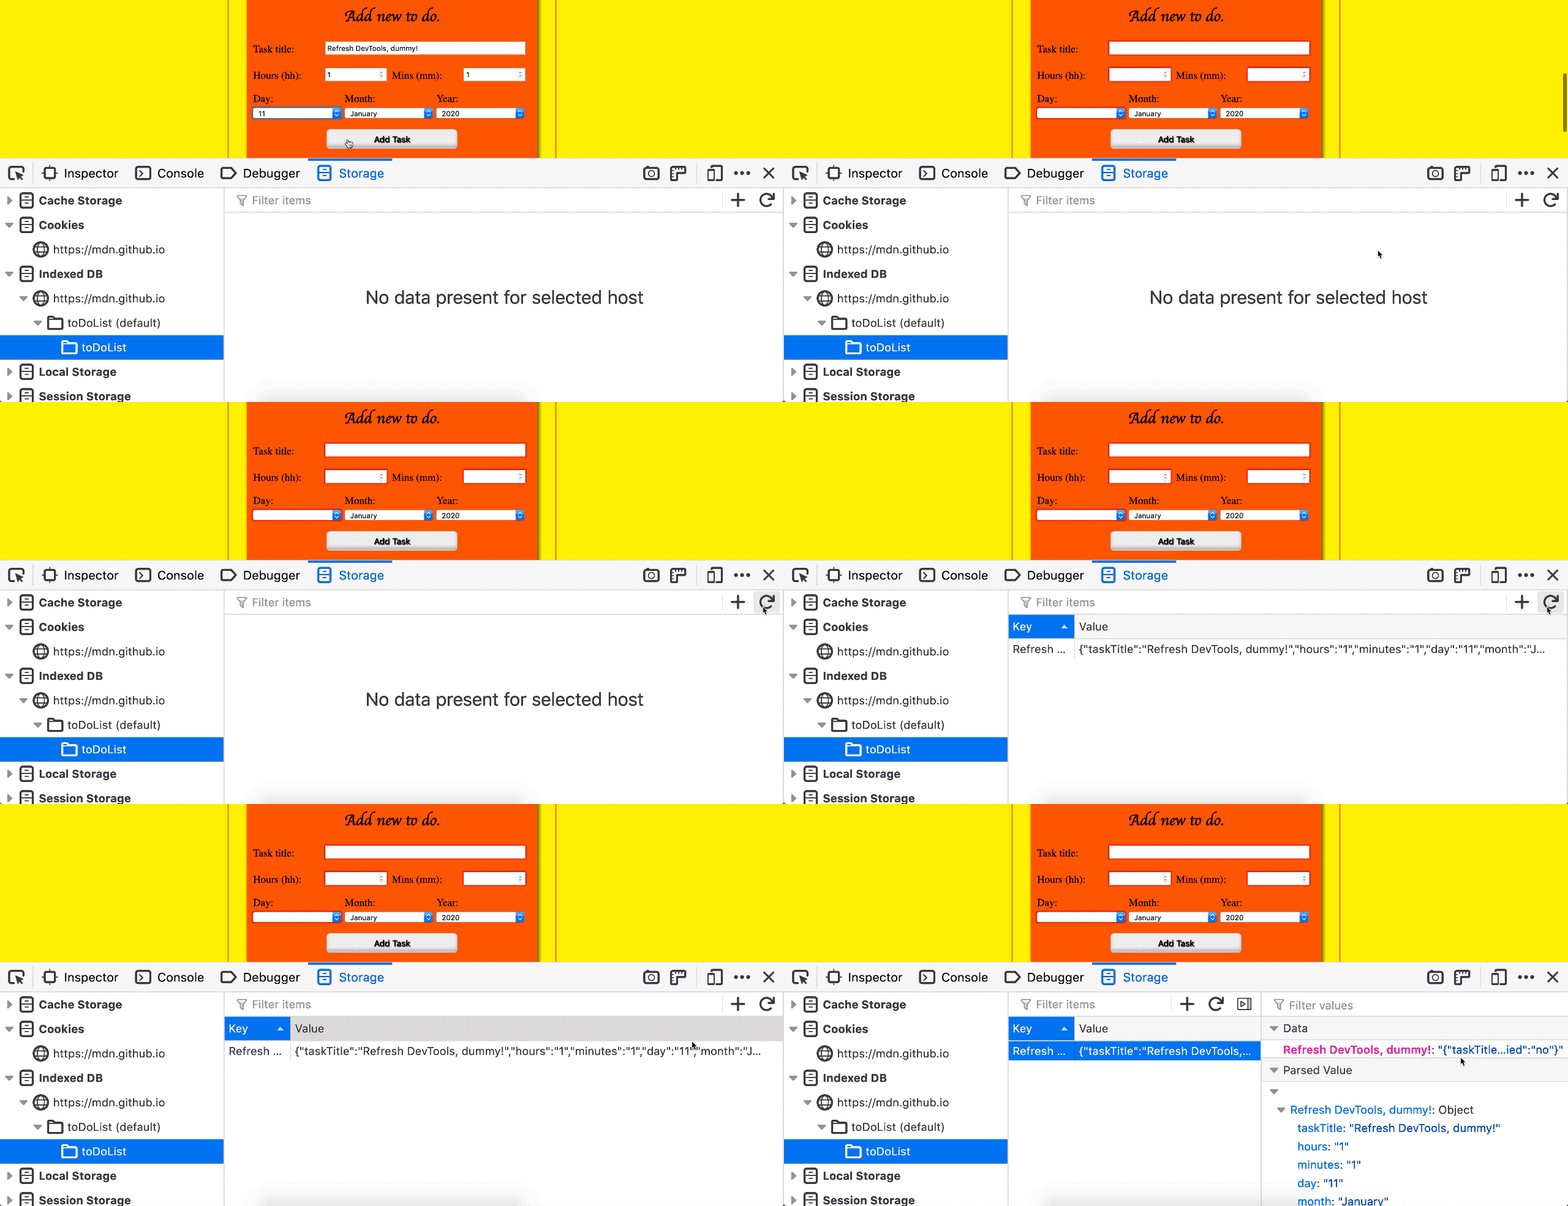
You can’t see IndexedDB entries being updated in real-time while the Storage Inspector is open, they are just a snapshot from when the Storage Inspector was opened. To get a more current snapshot, you’ll have to use the refresh button at the top left of the panel.
Change Table Headers

You can change table headers for the tables in the Storage Inspector. While most tables are key / value pairs and it doesn’t make a lot of sense to hide anything, it is really useful to be able to do so for cookies. Right-clicking the table header will show you enabled/disabled column headers, and you can toggle them.
This is part of a series I try to update regularly, I’ve gathered so many tricks over the years. If you’ve liked this or want to see more, I’m @lakatos88 on Twitter, follow me there!
